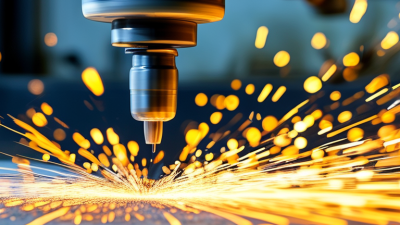
Choosing Automatic Polishing Lines in 2026 requires more than comparing machine prices or counting polishing heads. Buyers must examine the entire production process, from loading and abrasive control to inspection and final cleaning. A line may look impressive beside a showroom floor, yet perform poorly with real parts, uneven edges, or changing batch sizes.
Dr. Ioan D. Marinescu, a recognized authority in abrasive and finishing technology, stated, “The abrasive processes are very complex and difficult to understand.” That warning remains relevant. A reliable Automatic Polishing Lines solution should match the material, geometry, surface standard, and factory environment. Stainless steel tubes need different pressure control than aluminum castings. Decorative panels may require slower movement, finer compounds, and more careful defect detection. Small details matter.
Experience also means testing before committing. Ask the supplier to polish your actual workpieces, not only samples prepared for demonstrations. Measure cycle time, surface roughness, compound consumption, labor needs, and maintenance intervals. Watch the operator change a fixture. It reveals practical weaknesses.
Do not ignore software. Recipe storage, sensor feedback, alarm records, and remote diagnostics can reduce repeated setup work. Still, automation is not magic. Poorly prepared parts can create inconsistent results, even on advanced equipment. Some specifications may be overlooked during purchasing. That is a common mistake.
This guide explains how to compare Automatic Polishing Lines in 2026, balance automation with flexibility, and select equipment that remains dependable beyond the first impressive trial.
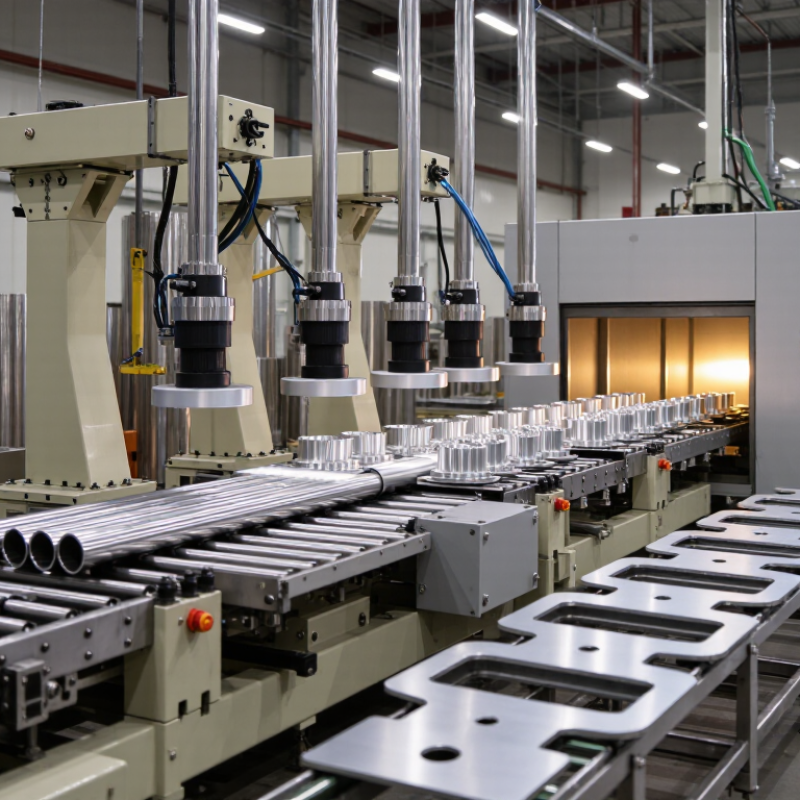
A polishing line should begin with measurable requirements, not machine speed. Set the surface target at Ra ≤0.2 μm before comparing equipment. Also define dimensional tolerance at ±0.05 mm. These values affect abrasive selection, fixture design, feed control, and final inspection. A bright surface is not always a uniform surface.
Measure real samples. Use a calibrated surface profilometer across several areas, including edges and recessed zones. Check dimensions with a coordinate measuring machine or suitable gauges. One reading is not enough. Record results before and after polishing. I have seen parts pass a visual check but fail near mounting holes. Small distortions can appear after repeated pressure and heat.
Ask suppliers for process-capability data using parts similar to yours. Review Cp and Cpk values, inspection methods, cycle stability, and maintenance records. Request a trial run with production material, not only a polished demonstration piece. Keep abrasive pressure, line speed, coolant temperature, and fixture position documented. Operators still matter. Automation reduces variation, but it does not remove poor setup decisions. A perfect specification may also be unrealistic for every geometry. Recheck the tolerance after several production batches, especially when tooling begins to wear.
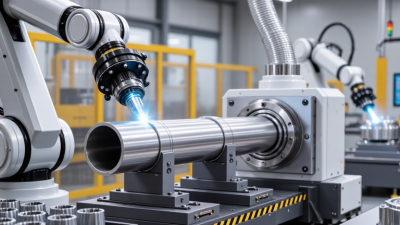
How to Choose Automatic Polishing Lines in 2026?
Match Line Capacity to Demand: Compare 8–24 Parts per Minute Throughput
An automatic polishing line rated at 8 parts per minute produces 480 parts hourly. At 24 parts per minute, theoretical output reaches 1,440 parts. Real output varies. Loading, fixture changes, inspections, and rejected parts reduce that figure. A practical capacity model should include operating efficiency, not only the machine’s headline speed. Many factories should calculate using 70–85% effective utilization until proven otherwise. That gap matters.
Deloitte’s 2024 Smart Manufacturing survey found that 86% of manufacturing leaders expect smart operations to become a primary competitiveness factor within five years. Meanwhile, the International Federation of Robotics reported 541,302 industrial robots installed globally in 2023. These figures support automation, but they do not justify buying the fastest line. Compare hourly demand, product mix, shift length, and planned growth. A line producing 1,000 parts daily may need only 8–12 parts per minute, depending on working hours. A 24-part line could create excess capacity, higher energy use, and more difficult changeovers.
Tips: Measure demand over twelve months, then add a controlled reserve of 10–20%. Ask suppliers for cycle-time records using your actual part shape and surface finish. Check polishing consistency at maximum speed. I would also request a small production trial. This is where estimates get messy. One overlooked fixture change can invalidate the spreadsheet. Select the line that meets demand reliably, rather than the one with the largest number on its brochure.
Throughput comparison from 8–24 parts per minute for preliminary production-capacity planning
| Nominal Line Speed (parts/min) |
Hourly Throughput (parts/hour) |
Estimated Good Output per 8-Hour Shift (85% OEE) |
Recommended Daily Demand Range (70–85% Loading) |
Typical Use Case | Planning Consideration |
|---|---|---|---|---|---|
| 8 | 480 | 3,264 | 2,285–2,774 parts/day | Low-volume production, frequent product changes, or pilot programs | Provides the greatest scheduling flexibility and the lowest risk of excess capacity. |
| 12 | 720 | 4,896 | 3,427–4,162 parts/day | Small-to-medium batches with moderate and relatively stable demand | A practical choice when demand is growing but does not yet justify a high-speed line. |
| 16 | 960 | 6,528 | 4,570–5,549 parts/day | Regular production of standardized parts with repeatable finishing requirements | Balances automation efficiency, changeover time, and room for demand variation. |
| 20 | 1,200 | 8,160 | 5,712–6,936 parts/day | Medium-to-high volume production with consistent part geometry | Suitable when forecast demand is dependable and material handling can support continuous flow. |
| 24 | 1,440 | 9,792 | 6,854–8,323 parts/day | High-volume production with long campaigns and limited product variation | Best used when demand is sustained; otherwise, utilization and payback may be reduced. |
Calculation basis: Estimated good output assumes one 8-hour shift and 85% overall equipment effectiveness (availability × performance × quality). The recommended demand range uses 70–85% of estimated good-shift output, leaving capacity for changeovers, maintenance, demand peaks, and process variation. Actual polishing-line capacity depends on part size, surface condition, polishing steps, fixture design, loading method, inspection requirements, and required finish quality.
When choosing an automatic polishing line in 2026, treat 85% OEE as a performance threshold, not a sales promise. OEE combines availability, speed, and quality. Ask suppliers to show each calculation separately. Numbers need context. A line running one easy aluminum part may report excellent results. Production reality is rarely so gentle.
Require repeatability data from a controlled trial using your actual workpieces. Measure surface roughness, edge consistency, cycle time, and dimensional variation across multiple shifts. Request results from at least 30 consecutive parts, not five perfect samples. Test the hard parts. Include curved surfaces, narrow edges, different material hardness, and realistic abrasive wear. Record every stoppage, manual adjustment, tool change, and rejected part.
A useful acceptance test should also compare results between operators. If quality changes sharply between shifts, the automation is not yet stable.
Review the data with an independent process engineer when possible. Check whether the reported 85% OEE excludes setup time, maintenance delays, or rework. That gap matters.
One practical evaluation may show strong first-hour performance, followed by declining finish quality as polishing media wears. This is not necessarily failure, but it requires a replacement schedule and cost estimate. Ask for raw machine logs, measurement methods, sample sizes, and failure explanations. Reliable suppliers should discuss weak results openly, because repeatability is more valuable than a polished demonstration.
When choosing an automatic polishing line in 2026, verify safety before judging speed or surface quality. A glossy brochure is not evidence. Ask for documented risk assessments, guarding layouts, emergency-stop tests, and validation records. The supplier should explain which ISO 10218 edition applies to the complete robotic system. Compliance must cover the robot, tools, fixtures, conveyors, and operator access points.
Check safety functions during a real production trial. Open a guarded door and observe the shutdown response. Test restart prevention after an emergency stop. Inspect light curtains, interlocks, reduced-speed modes, and safe maintenance access. These details reveal practical engineering quality. A line may pass a demonstration yet remain difficult to inspect or clean. That weakness matters.
PLC connectivity deserves equal attention. Confirm the communication protocol, signal list, response times, and fault-handling logic before installation. The PLC should receive clear status signals, cycle confirmation, alarm codes, safety states, and production counts. It should also send recipes, job numbers, start commands, and controlled stop requests. Use a written interface document. Then test every signal with the polishing line disconnected from production. This exposes missing handshakes and unclear alarm ownership. Cybersecurity and network segregation also require review. Many projects underestimate them. That is a costly oversight. A reliable integrator should provide wiring diagrams, software backups, change records, and operator training. Do not accept “ready for integration” without a witnessed PLC test.
Ownership value should guide your choice, not the purchase price alone. Set a two-to-three-year payback target before comparing equipment. Calculate labor, electricity, maintenance, tooling, downtime, and rejected parts. The U.S. Department of Energy reports that compressed-air leaks can waste 20–30% of compressor output. A polishing line with leak detection, efficient motors, and standby controls can reduce avoidable consumption. However, a 10–30% energy saving is a target, not a promise.
Measure your current line for at least one production week. Record kilowatt-hours per finished part, operator hours, abrasive use, and unplanned stops. Then request supplier calculations based on your actual part mix. The International Energy Agency identifies energy efficiency as a major industrial cost lever, but factory results depend heavily on operating conditions. A line running below capacity may not achieve the projected return.
Our first spreadsheet was too optimistic. We ignored changeover losses and cleaning time. Recalculate with conservative output, higher electricity prices, and one maintenance interruption each quarter. A reliable estimate should show the payback under normal conditions, not only ideal production. Ask for measured cycle times and energy data from comparable applications. Include power monitoring during acceptance testing. Small details matter. A two-year return can become four years when utilization falls by 20%.